Gadgets are small programs which generate images or HTML code from information which
is provided by NagVis. The main idea is to provide the performance data
of Nagios to these programs for visualizing it as nice graphs or fancy
speedometers, thermometers etc.
share/userfiles/gadgets/ contains some examples, others can be found at Nagvis Exchange[1].
The gadgets can be written in any language which can be interpreted by your webserver. Some options can be PHP, Perl,...
Gadgets are only supported for service objects. An object can be turned into a gadget by setting view_type="gadget" and a valid gadget_url.
NagVis supports gadgets since version 1.4.[1]
Since NagVis 1.6 the gadgets can not only render images. As new option the gadgets
can render HTML code which might also contain javascript or any kind of dynamic HTML code.
To enable the usage of HTML the option gadget_type needs to be set to "html".
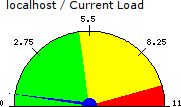
NagVis 1.4 std_speedometer gadget on test map with enabled label.
The gadgets get their information via a HTTP-Get call from NagVis (if you include share/userfiles/gadgets/gadgets_core.php it will be placed in two arrays. For more information take a look at the description there).
The following parameters are being passed to the gadgets:
| Parameter | Example value | Description | Variable |
|---|---|---|---|
| name1 | localhost | The name of the host | $aOpts['name1'] |
| name2 | Current Load | The service description of the object | $aOpts['name2'] |
| scale | 100 | The scale of the gadget | $aOpts['scale'] |
| state | OK | The string which represents the current state (OK, WARNING, CRITICAL, UNKNOWN) | $aOpts['state'] |
| stateType | HARD | The type of the current state. Can be HARD or SOFT | $aOpts['stateType'] |
| ack | 0 | Is set to 1 if the represented object state has been acknowledged | $aOpts['ack'] |
| downtime | 0 | Is set to 1 if the represented object state is in a downtime | $aOpts['downtime'] |
| perfdata | load1=0.960;5.000;10.000;0; load5=0.570;4.000;6.000;0; load15=0.540;3.000;4.000;0; | The current performance data information provided by Nagios. It's important to have valid performance data here. | $aPerfdata[<index>][<tag>] |
A valid http get on the std_speedometer.php looks like this:
std_speedometer.php?name1=localhost&name2=Current%20Load&state=OK&stateType=HARD&perfdata=load1=0.450;5.000;10.000;0;%20load5=0.260;4.000;6.000;0;%20load15=0.750;3.000;4.000;0;
Please check the parameters view_type, gadget_url and gadget_opts of the service object in the map configuration format description. This is an example of a definition in your map file:
define service {
   host_name=localhost
   service_description=root-volume
   x=50
   y=50
   view_type=gadget
   gadget_url=std_bar.php     // name of the file in share/userfiles/gadgets/
   // gadget_url=[http://localhost/nagvis/userfiles/gadgets/std_bar.php]     // valid as well
   // gadget_scale=200        // default is 100 (percent)
   // gadget_opts=columns=3 label=1    // gadget dependent
   // gadget_type=img         // Defaults to img, can also be set to "html"
}
Using the code shown included in gadgets_core.php two arrays are filled. $aPerfdata contains the performance data. $aOpts contains the options set in gadget_opts.
The best thing is to take a look at the code of the standard gadgets and adapt the core things from there.
You should set a sample perfdata string in the gadget code by writing it to
the variable $sDummyPerfdata. This makes it possible to show the gadget with
dummy data during editing. It's much easier to edit the maps when the gadgets are shown.
Important: The variable needs to be set before the gadgets_core.php is included.
A second example can be found in std_speedometer2.php. In contrast to std_speedometer.php it supports output produced by check_multi. The background will be set to yellow or red if the performance data indicates such a state. The service state is not taken into account. Several options set via gadget_opts influence the behaviour of the gadget:
| Parameter | Example value | Description |
|---|---|---|
| label | 1 | 1 = Show host name / service description in the upper left corner of the graph; 0 = don't show the information (default) |
| current | 1 | 1 = Show the current performance data value (default); 0 = don't show the information |
| columns | 5 | Graphs can be arranged in columns. The number of rows is calculated based on the maximum number of performance data items. Default is 3 |
| string | pct | The performance data label has to contain the string to be displayed. In case of check_multi output only the last part is examined. Default is an empty string |
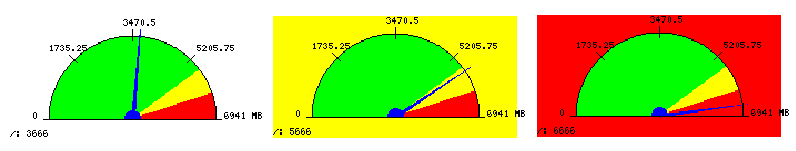
NagVis 1.5 std_speedometer2 gadget in normal, warning and critical state
A third example is based on an idea found on Nagvis Exchange. Performance data is shown as a horizontal bar. The last quarter of the graph changes to yellow or red if the performance data indicates a warning or critical value. The status is not the state of the service! That is due to the fact that the data might contain multiple data sources. In many cases not all data sources of a service are found to be in a warning or critical state so you don't want to get false alarms (new in 1.5.7 or git newer than 2010.12.12).
| Parameter | Example value | Description |
|---|---|---|
| label | 1 | 1 = Show host name / service description label in the last quarter of the graph (default); 0 = don't show the information |
| current | 1 | 1 = Show the current performance data value (default); 0 = don't show the information |
| columns | 5 | Graphs can be arranged in columns. The number of rows is calculated based on the maximum number of performance data items. Default is 3 |
| string | pct | The performance data label has to contain the string to be displayed. In case of check_multi output only the last part is examined. Default is an empty string |
| threshold | value | Determines if the warning and critical thresholds are shown in percent (default) or integer values |
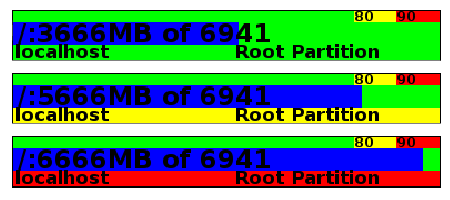
NagVis 1.5 std_bar gadget in normal, warning and critical state
Note: This gadget uses a TrueType font whose name and location is hard coded within the code (variables $fontDir and $fontName). In case the file isn't found the gadget uses a builtin font. The value of $fontDir changes between distributions so if the font doesn't scale properly please check the setting (it defaults to OpenSuSE, other settings are commented out).
[1] The directory structure changed between NagVis 1.4.x and NagVis 1.5. Gadgets were stored innagvis/nagvis/gadgets and are now stored in share/userfiles/gadgets. Gadgets found on NagVis Exchange might use the former structure so you might have to move the files to the new location (e.g. cp -pr <source>/nagvis/nagvis/gadgets/<gadget> <target>/share/userfiles/gadgets/).